Credicorp's Financial
Inclusion
Credicorp

For the third consecutive year, we present the Credicorp Financial Inclusion Index. En esta edición, el estudio se ha realizado en 8 countries in Latin America and incorporates 19 social measurement indicators.

Download e-book

Learn more about financial Inclusion

Video: Regional results of the Credicorp Financial Inclusion Index 2023

Results of the Index

The results of the Financial Inclusion Index and its dimensions are expressed in scores with a minimum value of 0 and a maximum of 100, where a higher score means a better level of financial inclusion.

Important Findings:

Mapa de inclusión financiera

The region's financial inclusion reaches a medium-low level, with a score of 45.5 ut of 100, compared to the 44.2 obtained in 2022.

Billeteras digitales

The percentage of frequent users of digital wallets is one of the indicators that grew the most in the three editions of the study.

Dimensiones de inclusión financiera

Perceived Quality s the dimension with the best score (60.9) but the dimensions of Use (30.5) y Uso (30,5) continue to be the most critical.

Países con nivel bajo

In Peru (42%), Mexico (43%) and Bolivia (43%), 2 out of every 5 citizens have a low level of financial inclusion.

Países con nivel alcanzado

Chile (38%), Argentina (38%) and Panama (36%) are the countries with the highest percentage of citizens with an Achieved level of financial inclusion.

Evolución nivel alcanzado

In 2021, only 16% of the Latin American population had an Achieved level of financial inclusion. Today, this figure is 24%.

Analysis by countries

General Access Use Quality Perceived
2022 2023
Argentina Argentina 49,0 53,0
Chile Chile 52,3 52,5
Panamá Panamá 54,6 52,0
Ecuador Ecuador 48,9 49,6
Colombia Colombia 44,7 45,6
Perú Perú 39,8 43,3
México México 41,5 41,7
Bolivia Bolivia 38,3 40,4
2022 2023
Argentina Argentina 56,1 61,1
Panamá Panamá 52,7 53,9
Chile Chile 54,5 52,3
Ecuador Ecuador 50,5 49,5
Colombia Colombia 47,0 48,6
Perú Perú 41,5 46,5
Bolivia Bolivia 42,4 45,3
México México 39,5 35,1
2022 2023
Chile Chile 46,8 49,1
Argentina Argentina 38,3 42,8
Panamá Panamá 41,7 35,1
Ecuador Ecuador 30,8 31,2
México México 26,5 26,5
Colombia Colombia 25,2 26,3
Perú Perú 22,0 25,9
Bolivia Bolivia 19,9 20,5
2022 2023
Ecuador Ecuador 65,5 68,2
Panamá Panamá 69,3 67,1
México México 58,4 63,6
Colombia Colombia 62,0 62,1
Perú Perú 55,9 57,6
Chile Chile 55,5 56,2
Bolivia Bolivia 52,7 55,5
Argentina Argentina 52,6 55,1

Demographic Analysis

Gender

Men (26%) are more financially included than women (21%).

Análisis Demográfico por Género

Informality

Formal workers (42%) have a higher level of financial inclusion than informal workers (18%) or than unemployed citizens (13%).

Informalidad

Urban vs Rural

People living in urban areas (26%) are more included than people living in rural areas (14%).

Análisis Demográfico por Espacio

Learn about the methodology used in this report

The Study

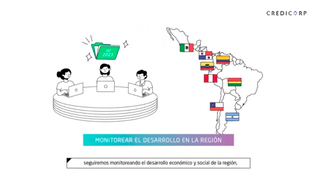
The objective of the study was to develop an indicator of financial inclusion that allows monitoring this issue in 8 countries of the region.

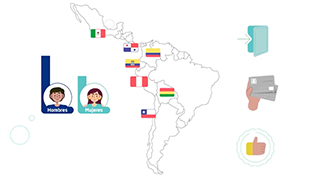
1,200 household surveys were carried out per country, at the urban and rural levels, except in Peru, where 5,000 were carried out. The universe of participants was made up of men and women over 18 years of age. The margin of error is +-2.8% with a confidence level of 95%.

The Index

Credicorp's Financial Inclusion Index (IIF) evaluates the level of financial inclusion of countries based on its efficiency in 3 dimensions: Access, Use and Quality Perceived.

Access Use Quality perceived

Access

This dimension measures the capacity of individuals to access or use formal financial services.

Sub-dimension Indicator
Financial infrastructure
  • 1

    Number of barriers for the use of financial infrastructure.

Knowledge of products
  • 2

    Number of formal financial products you are familiar with.

Product possession
  • 3

    Number of savings/insurance products that are possessed.

  • 4

    Number of credit products that are possessed.

  • 5

    Number of entities of which you are a customer.

  • 6

    Possession of credit products in a formal entity.

  • 7

    Number of barriers to having financial products.

Use

This dimension measures the intensity, frequency and permanence of use or utilization of financial services and products.

Sub-dimension Indicator
Basic transactions
  • 8

    Number of banking venues used to pay different types of products or services.

  • 9

    Number of formal venues used to make transfers.

Income
  • 10

    Receives income through the formal financial system.

Savings
  • 11

    Saves through the formal financial system.

Quality perceived

This dimension is comprised of two sub-dimensions: trust and perception of the quality of the financial system and assesses aspects such as general image of financial entities, ease of obtaining products or variety of product offerings, breadth of the financial system, among others.

Sub-dimension Indicator
Trust
  • 12

    Overall score for trust in the system.

Quality
  • 13

    General assessment of the image of financial institutions.

  • 14

    General assessment of the ease of obtaining a savings or credit product.

  • 15

    General assessment of the physical extent of the financial system.

  • 16

    General assessment of the variety of savings and credit products offered by the financial system.

  • 17

    General assessment of the costs to users of the financial system.

  • 18

    General assessment of the usefulness of digital media.

  • 19

    Perceived security.

Savings
  • 8

    Saves through the formal financial system.